Brock Presentation
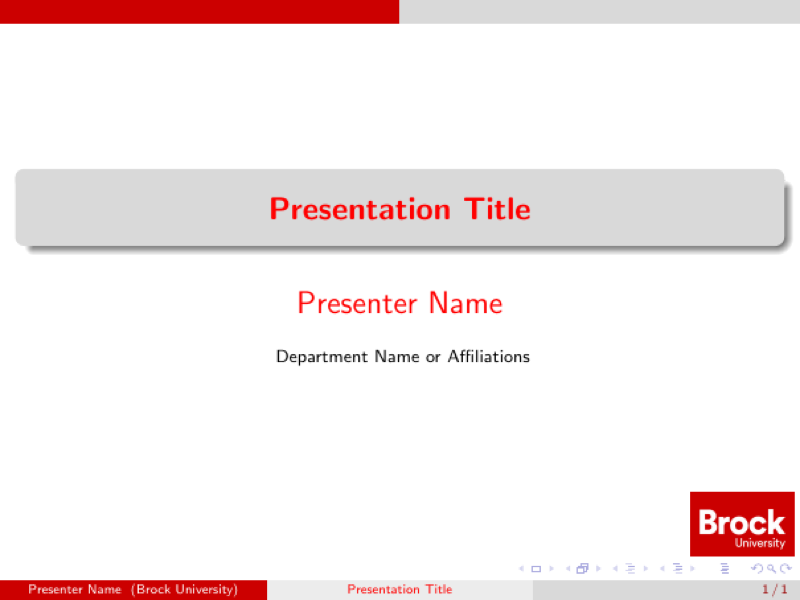
The "Brock University Presentation Slides Template in LaTeX" project aims to develop a professional, standardized template for creating presentation slides using LaTeX. This template is tailored specifically for Brock University, incorporating the university's branding elements such as colors, logos, and typography.
Category
universityLicense
Free to use (MIT)File
main.tex
main.texRead-only preview
\documentclass{beamer} % Beamer document class for presentations
\usetheme[secheader]{Boadilla} % Theme for the presentation
% \setbeamertemplate{navigation symbols}{} % Remove navigation symbols
\usepackage{tcolorbox} % For colored boxes and text
\usepackage{tikz} % For drawing graphics and diagrams
\usepackage{mwe} % For including example pictures (used in this document)
\usepackage{siunitx} % For typesetting SI units
\usepackage{hyperref} % For hyperlinks
%\usepackage[table]{xcolor} % For coloring tables
% Additional packages for TikZ and related features
\usepackage{tikz}
\usepackage{tcolorbox}
\definecolor{BrockRed}{RGB}{204,0,0} % Brock Red
% \usecolortheme[named=BrockRed]{structure}
\usecolortheme{beaver}
\usepackage{colortbl} % For colored cells in tables
\usepackage{xcolor} % For defining custom colors
\usepackage{graphicx} % For \cellcolor command
\usetikzlibrary{positioning, arrows.meta} % Additional TikZ libraries for positioning and arrow styles
\usepackage{color} % For custom color definitions
\usepackage{epsfig} % For EPS figures
\usepackage{ifpdf} % For conditional checks based on output format
\usepackage[latin1]{inputenc} % Input encoding
\usepackage{multimedia} % For including multimedia elements in presentations
\usepackage{svg}

% Define custom colors
\definecolor{Mahogany}{cmyk}{0,0.85,0.87,0.35}
\definecolor{Mahogany}{RGB}{43,117,22}

% Additional packages for mathematical typesetting and symbols
\usepackage{latexsym}
\usepackage{amsmath,amsthm,amssymb} % For mathematical environments and symbols
\usepackage{amsmath}
\usepackage{mathrsfs} % For additional math fonts

\usepackage{listings} % For typesetting code
\usepackage{xcolor}   % For customizing colors

% Define colors for code highlighting
\definecolor{mygreen}{RGB}{0,128,0}
\definecolor{mygray}{RGB}{128,128,128}
\definecolor{mymauve}{RGB}{128,0,128}

% Define the style for Python code
\lstset{
  language=Python,
  basicstyle=\normalsize\ttfamily,
  keywordstyle=\color{blue},
  commentstyle=\color{mygreen},
  numberstyle=\tiny\color{mygray},
  stringstyle=\color{mymauve},
  breaklines=true,
  breakatwhitespace=true,
  %numbers=left,
  frame=single,
  showstringspaces=false,
  captionpos=b,
}


\definecolor{darkred}{rgb}{139, 0, 0}
\ifpdf
  \DeclareGraphicsExtensions{.png,.pdf}
\else
  \DeclareGraphicsExtensions{.eps}
\fi


%%%%%%%%%%%%%%%%%%%%%% title page %%%%%%%%%%%%%%%%%%%%%%%%%%%%%

% Set the short title for the presentation (appears in the header)
\title[\textcolor{red}{Presentation Title}]{\textbf{Presentation Title}}

% Set the author information with a colored name (appears in the footer)
\author[\textcolor{white}{Presenter Name}]{{\Large\textcolor{red}{Presenter Name}}}
\vspace{0.5cm}
%\large{Supervised by
%\textbf{Your Supervisor Name}}}
% Define a command to set the frame author (date in this case)
\newcommand{\frameauthor}[1]{\date{#1}}

% Set the institute information with a colored short university name (appears in the footer)
\institute[\textcolor{white}{Brock University}]{
Department Name or Affiliations}

% Set the date of the presentation (today's date in this case)
\date{}
\logo{\includegraphics[height=1cm]{Figures/BrockU-2022-RGB-Top-1050x636.jpg}}

%%%%%%%%%%%%%%%%%%%%%%%%% end title page %%%%%%%%%%%%%%%%%%%%%%%%


\AtBeginSubsection[] {
  \begin{frame}<beamer>
%    \frametitle{Abstract}
    \tableofcontents[currentsection,currentsection]
  \end{frame}
}
%%%%%%%%%%%%%%%%%%%%%%%%%%%%%%%%%%%%%%%%%%%%%%%%
%%%%%%%%%%%%%%%%%%%%%%%%%%%%%%%%%%%%%%%%%%%%%%%%
%%%%%%%%%%%%%%%%%%%%%%%%%%%%%%%%%%%%%%%%%%%%%%%%
% zaciname
%%%%%%%%%%%%%%%%%%%%%%%%%%%%%%%%%%%%%%%%%%%%%%%%
%%%%%%%%%%%%%%%%%%%%%%%%%%%%%%%%%%%%%%%%%%%%%%%%
%%%%%%%%%%%%%%%%%%%%%%%%%%%%%%%%%%%%%%%%%%%%%%%%

\begin{document}
%{\footnotesize{
%%%%%%%%%%%%%%%%%%%%%%%%%%%%%%%%%%%%%%%%%%%%%%%%
%%%%%%%%%%%%%%%%%%%%%%%%%%%%%%%%%%%%%%%%%%%%%%%%
%%%%%%%%%%%%%%%%%%%%%%%%%%%%%%%%%%%%%%%%%%%%%%%%%%
%\begin{frame}
%\includegraphics[width=\linewidth]{}
%\end{frame}
%%%%%%%%%%%%%%%%%%%%%%%%%%%%%%%%%%%%%%%%%%%%%%%%%%
%%%%%%%%%%%%%%%%%%%%%%%%%%%%%%%%%%%%%%%%%%%%%%%%%%
%%%%%%%%%%%%%%%%%%%%%%%%%%%%%%%%%%%%%%%%%%%%%%%%
\begin{frame}
  \titlepage
\end{frame}
%%%%%%%%%%%%%%%%%%%%%%%%%%%%%%%%%%%%%%%%%%%
%%%%%%%%%%%%%%%%%%%%%%%%%%%%%%%%%%%%%%%%%%%
%%%%%%%%%%%%%%%%%%%%%%%%%%%%%%%%%%%%%%%%%%
\begin{frame}\frametitle{Outline}
  \tableofcontents[hideallsubsections]
\end{frame}
%%%%%%%%%%%%%%%%%%%%%%%%%%%%%%%%%%%%%%%%%%%
%%%%%%%%%%%%%%%%%%%%%%%%%%%%%%%%%%%%%%%%%%%
%%%%%%%%%%%%%%%%%%%%%%%%%%%%%%%%%%%%%%%%%%
\section{Introduction}
    \begin{frame}[plain]
        \vfill
      \centering
      \begin{beamercolorbox}[sep=8pt,center,shadow=true,rounded=true]{title}
        \usebeamerfont{title}\insertsectionhead\par%
        \color{blue}\noindent\rule{10cm}{1pt}
      \end{beamercolorbox}
      \vfill
  \end{frame}
\begin{frame}{Title}
    \begin{itemize}
        \item Bullet Point 1
        \item Bullet Point 2
        \begin{enumerate}
            \item Sub Bullet Point 1
            \item Sub Bullet Point 2
            \item Sub Bullet Point 3
        \end{enumerate}
        \item \lipsum[1][1] \cite{nsga2}.
        \item \lipsum[1][2] \cite{nsga2}.
        \item \lipsum[1][3] \cite{nsga2}.
    \end{itemize}
\end{frame}

\section{Section 2}
    \begin{frame}[plain]
        \vfill
      \centering
      \begin{beamercolorbox}[sep=8pt,center,shadow=true,rounded=true]{title}
        \usebeamerfont{title}\insertsectionhead\par%
        \color{orange}\noindent\rule{10cm}{1pt}
      \end{beamercolorbox}
      \vfill
  \end{frame}

\begin{frame}{Title}
\begin{itemize}
    \item \lipsum[1][1].
    \begin{align}
        \text{Minimize:} \ {f_{1}(x), f_{2}(x), ..., f_{m}(x)} \nonumber \\
        \text{Subject to:} \ g_j(x) \leq 0,\ j=0,1,...,n
    \end{align}
\end{itemize}
\end{frame}

\begin{frame}{Title}
\begin{columns}[T]
    \begin{column}{.45\textwidth}
        \begin{figure}
        \centering
        \includegraphics[scale=0.05]{Figures/Brock-LINC-Project-South-Elevation.jpg}
        \caption{Caption.}
        \label{fig:label1}
        \end{figure}
    \end{column}
    \begin{column}{.48\textwidth}
        \begin{figure}
            \centering
            \includegraphics[scale=0.05]{Figures/Brock-LINC-Project-South-Elevation.jpg}
            \caption{Caption.}
            \label{fig:label2}
        \end{figure}
    \end{column}
\end{columns}

\end{frame}

\begin{frame}{Title}
\begin{columns}[T]
    \begin{column}{.45\textwidth}
        \begin{figure}
        \centering
        \includegraphics[scale=0.05]{Figures/Brock-LINC-Project-South-Elevation.jpg}
        \caption{Caption.}
        \label{fig:label1}
        \end{figure}
    \end{column}
    \begin{column}{.48\textwidth}
        \begin{figure}
            \centering
            \includegraphics[scale=0.05]{Figures/Brock-LINC-Project-South-Elevation.jpg}
            \caption{Caption.}
            \label{fig:label2}
        \end{figure}
    \end{column}
\end{columns}

    \begin{itemize}
        \item Linear function:
        \begin{equation}
            y=aX+b
        \end{equation}
    \end{itemize}
\end{frame}

\begin{frame}{Title}
    \begin{columns}[T] % align columns
\begin{column}{.5\textwidth}
Linear function:
        \begin{equation}
            y=aX+b
        \end{equation}
Linear function:
        \begin{equation}
            y=aX+b
        \end{equation}
\end{column}%
\hfill%
\begin{column}{.5\textwidth}
\begin{figure}
        \centering
        \includegraphics[scale=0.05]{Figures/Brock-LINC-Project-South-Elevation.jpg}
        \caption{Caption.}
        \label{fig:label4}
    \end{figure}
\end{column}%
\end{columns}


\end{frame}


\section{Section 3}
    \begin{frame}[plain]
        \vfill
      \centering
      \begin{beamercolorbox}[sep=8pt,center,shadow=true,rounded=true]{title}
        \usebeamerfont{title}\insertsectionhead\par%
        \color{blue}\noindent\rule{10cm}{1pt}
      \end{beamercolorbox}
      \vfill
  \end{frame}


\begin{frame}{Results}

    \begin{table}
        \centering
        \begin{tabular}{|c|c|c|c|c|} \hline
            - & Col1 & Col2 & Col3 & Col4\\ \hline
            Row2 & - & - & - & -\\ \hline
            Row3 & -& -& -& \textbf{-}\\ \hline
            Row4 & -& -& -& \textbf{-}\\ \hline
            Row5 & -& -& -& -\\ \hline
        \end{tabular}
        \caption{Table.}
        \label{tab:table1}
    \end{table}
\end{frame}

\section{Conclusion}
    \begin{frame}[plain]
        \vfill
      \centering
      \begin{beamercolorbox}[sep=8pt,center,shadow=true,rounded=true]{title}
        \usebeamerfont{title}\insertsectionhead\par%
        \color{red}\noindent\rule{10cm}{1pt}
      \end{beamercolorbox}
      \vfill
  \end{frame}


\begin{frame}{Conclusion}
\begin{itemize}
    \item \lipsum[1][1]
    \item \lipsum[1][2]
    \item \lipsum[1][3]
    \item \lipsum[1][4]
\end{itemize}
\end{frame}


\begin{frame}[allowframebreaks]
        \frametitle{References}
\bibliographystyle{abbrv}
\bibliography{references}

\end{frame}

\section*{Thank you!}
    \begin{frame}[plain]
        \vfill
      \centering
      \begin{beamercolorbox}[sep=8pt,center,shadow=true,rounded=true]{title}
        \usebeamerfont{title}\insertsectionhead\par%
        \color{red}\noindent\rule{10cm}{1pt}
      \end{beamercolorbox}
      \vfill
  \end{frame}

\end{document}
Preview

PDF Preview
Create an account to compile and preview