template.texRead-only preview
% Written by Bibby AI
\documentclass[aspectratio=169]{beamer}

\usepackage{tikz}
\usepackage{booktabs}
\usepackage[normalem]{ulem}
\usepackage{bm}
\usepackage[dvipsnames]{xcolor}
\usetikzlibrary{positioning, fit}

% ======================================================================
% GRAPHICS
% ======================================================================
\usepackage{graphicx}
\graphicspath{{figures}}


% ======================================================================
% CONFIGURATIONS
% ======================================================================
\newcommand{\deftitle}{Such a nice beautiful title} % define title
\newcommand{\defauthor}{Author 1, Author 2, Author 3, Author 4 \\Author 5} % define authors
\newcommand{\definstitute}{Institute 1, Institute 2} % define institutes
\newcommand{\defdate}{Date of presentation} % use \today for automatic date

\title{\deftitle}
\author{\defauthor}
\institute{\definstitute}
\date{\today}

% ======================================================================
% TEMPLATE
% ======================================================================
\usetheme{Madrid}
\usecolortheme{default}
\setbeamertemplate{navigation symbols}{}
\setbeamercolor{footlinecolor}{use=date in head/foot, bg=date in head/foot.bg, fg=date in head/foot.fg}
\setbeamertemplate{footline}{
	% Hide footline on titlepage (frame number = 1)
	\ifnum\value{framenumber}=1
	\else
	\leavevmode
	\hbox{%
		\begin{beamercolorbox}[wd=.90\paperwidth,ht=2.5ex,dp=1ex,left]{footlinecolor}%
			\usebeamerfont{author in head/foot}\hspace{1em}\deftitle%
		\end{beamercolorbox}%
		\begin{beamercolorbox}[wd=.1\paperwidth,ht=2.5ex,dp=1ex,center]{footlinecolor}%
			\usebeamerfont{author in head/foot}\number\numexpr\insertframenumber\relax%
		\end{beamercolorbox}}%
	\vskip0pt%
	\fi
}

% ======================================================================
% DOCUMENT BEGINS HERE
% ======================================================================
\begin{document}
% Activate a background image only for this frame
	\usebackgroundtemplate{
		\includegraphics[width=\paperwidth,height=\paperheight]{i_retis_cover.pdf}
	}
	% Adjust this frame settings, if needed
	\begin{frame}[plain]
		\begin{flushright}
			{\usebeamercolor[fg]{title} \fontsize{20pt}{24pt}\selectfont \bfseries \deftitle \par}
			\vspace{0.5cm}
			{\color{white}\small \defdate \par}
			% uncoment to show institutes
%			\vspace{0.5cm}
%			{\color{white}\large \definstitute \par}
			\vspace{2cm}
			{\color{white}\large \defauthor \par}
			\vspace{0.3cm}
		\end{flushright}
	\end{frame}

	\usebackgroundtemplate{}

	\begin{frame}
		\frametitle{Table of Contents}
		\tableofcontents[]
	\end{frame}

	\begin{frame}
		\frametitle{\textit{Prelude}}
		\centering
		This is a \textit{prelude} slide
	\end{frame}

	\AtBeginSection[]
	{
		\begin{frame}
			\frametitle{Table of Contents}
			\tableofcontents[currentsection]
		\end{frame}
	}

	\section{This is a section}
		\subsection{This is a subsection}
			\begin{frame}
				\frametitle{This is a scheme}
				\centering
				\begin{tikzpicture}[remember picture, overlay, node distance=1cm, thick]

					\node[draw, rectangle, rounded corners, fill=red!20]
					(cal) at ([xshift=-0.7cm, yshift=-3cm]current page.north) {Calibration};
					\node[draw, rectangle, rounded corners, fill=green!20, left=of cal] (sim) {Simulator};
					\node[draw, rectangle, rounded corners, fill=blue!20, left=of sim] (data) {Data};
					\node[draw, rectangle, rounded corners, fill=yellow!20, right=of cal] (ctrl) {Controller};
					\node[draw, rectangle, rounded corners, fill=orange!20, right=of ctrl] (opt) {Optimisation};

					\draw[->] (data) -- (sim);
					\draw[->] (sim) -- (cal);
					\draw[->] (cal) -- (ctrl);
					\draw[->] (ctrl) -- (opt);

					\node[
					draw,
					rounded corners,
					fill=gray!20,
					below=2.2cm of ctrl,
					minimum height=1.5cm,
					] (system) {System Model};

					\node[draw, rounded corners, inner sep=0.2cm, color=blue, fit=(system), label={[yshift=-0.2cm]below:}] (sysbox) {};
					\node[font=\small, color=blue, below=0.1cm of sysbox.south] {Controller Model};

					\draw[->] (ctrl.south) -- (sysbox.north);

					\node[left=3cm of sysbox] (leftbase) {};

					% Arrow 1 (top)
					\draw[->] ([yshift=0.5cm]leftbase.east) --
					node[above, sloped, font=\small]{level setpoints}
					([yshift=0.5cm]sysbox.west);

					% Arrow 3 (bottom)
					\draw[->] ([yshift=-0.5cm]leftbase.east) --
					node[above, sloped, font=\small]{criteria}
					([yshift=-0.5cm]sysbox.west);

					\node[right=2.5cm of sysbox] (rightbase) {};

					% Arrow 1 (top)
					\draw[->] ([yshift=0.5cm]sysbox.east) --
					node[above, sloped, font=\small]{flows \& levels}
					([yshift=0.5cm]rightbase.west);

					% Arrow 3 (bottom)
					\draw[->] ([yshift=-0.5cm]sysbox.east) --
					node[above, sloped, font=\small]{merit value}
					([yshift=-0.5cm]rightbase.west);
				\end{tikzpicture}
			\end{frame}

	\section{This is another section}
		\subsection{This is another subsection}
			\begin{frame}
				\frametitle{Two columns: items, text and equation}
				\begin{columns}
					\hspace{0.1\textwidth}
					\begin{column}{0.4\textwidth}
						So many items
						\begin{itemize}
							\item \textcolor{blue}{item 1}
							\item \textbf{item 2}
							\item \sout{item 3}
							\item \textit{item 4}
						\end{itemize}
					\end{column}
					\begin{column}{0.5\textwidth}
						Some random text, \textcolor{blue}{blue} color is beautiful! \\
						\vspace{0.5cm}
						More random text: \textcolor{blue}{and more color} \\
						\vspace{0.5cm}
						But... let's see an \textcolor{blue}{equation} block?
					\end{column}
				\end{columns}
				\centering
				\vspace{1cm}
				\begin{block}{Equation block}
					\begin{equation}\nonumber
						\hat{v}(t) = \frac{v_{left} \cdot (t_{right} - t) + v_{right} \cdot (t - t_{left})}{t_{right} - t_{left}}
					\end{equation}
				\end{block}
			\end{frame}

			\begin{frame}
				\frametitle{Two columns: two images side by side}
				\begin{columns}
					\begin{column}{0.5\textwidth}
						\centering
						some \textcolor{blue}{blue} text up \textcolor{blue}{here}
						\begin{figure}[]
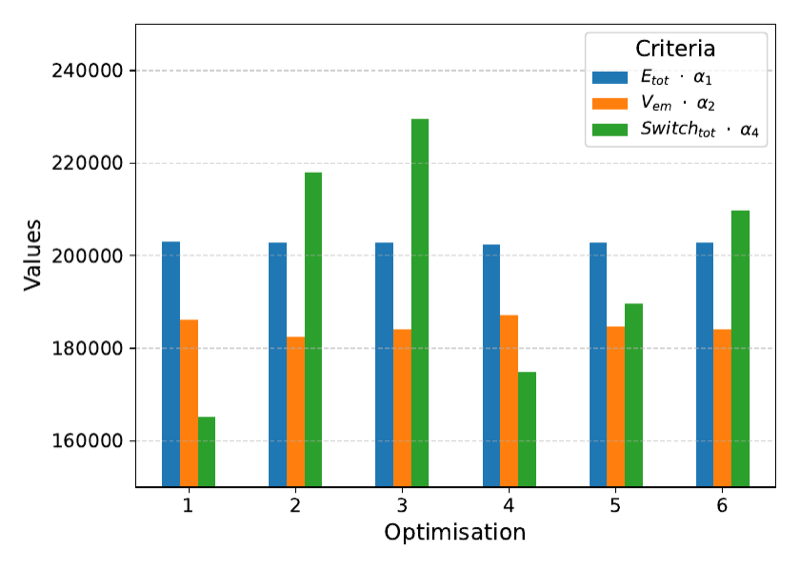
							\includegraphics[width=1\textwidth]{/example.pdf}
						\end{figure}
					\end{column}
					\begin{column}{0.5\textwidth}
						\centering
						some \textcolor{blue}{blue} text up \textcolor{blue}{here}
						\begin{figure}[]
							\includegraphics[width=1\textwidth]{/example.pdf}
						\end{figure}
					\end{column}
				\end{columns}
				\centering
				Some text down here
			\end{frame}

	\section{This is the last section}
		\subsection{This is the last subsection}
			\begin{frame}
				\frametitle{Two columns: enumerate text + image}
				\begin{columns}
					\begin{column}{0.35\textwidth}
						Wow! Look at this enumerate:
						\begin{enumerate}
							\item 1 1 1 1 1
							\item 2 2 2 2 2
							\item 3 3 3 3 3
							\item 4 4 4 4 4
							\item 5 5 5 5 5
							\item 6 6 6 6 6
						\end{enumerate}
						\vspace{0.5cm}
						Now I'm feeling \textcolor{blue}{nice}! But look at the image...
					\end{column}
					\begin{column}{0.65\textwidth}
						\centering
						\begin{figure}[]
							\includegraphics[width=1\textwidth]{/example.pdf}
						\end{figure}
					\end{column}
				\end{columns}
			\end{frame}

			\begin{frame}
				\frametitle{Two tables}
				\centering
				\footnotesize
				some \textcolor{blue}{text} here
				\begin{table}[]
					\begin{tabular}{l c c c c c c c c}
						\toprule
						& \multicolumn{5}{c}{\textbf{Applied to 1 day}} & \multicolumn{3}{c}{\textbf{Applied to 1 month}}\\
						\cmidrule(lr){2-6}\cmidrule(lr){7-9}
						\raisebox{2ex}[0pt][0pt]{\textbf{Parameter}} & \textbf{Real} & \textbf{Diff\_Evol} & $\boldsymbol{\Delta}$\textbf{(\%)} & \textbf{N-M} & $\boldsymbol{\Delta}$\textbf{(\%)} & \textbf{Diff\_Evol} & \textbf{N-M} & $\boldsymbol{\Delta}$\textbf{(\%)}\\
						\midrule
						$E_{tot}~\text{[kWh]}$ & 7958.07 & 8081.65 & \textcolor{Bittersweet}{+1.6} & 8045.06 & \textcolor{Bittersweet}{+1.1} & 203490 & 202691 & \textcolor{OliveGreen}{-0.4}\\
						$V_{em}~\text{[m}^3\text{]}$ & 7068.73 & 3150.39 & \textcolor{OliveGreen}{-55.4} & 3264.00 & \textcolor{OliveGreen}{-53.8} & 91625.5 & 91438.5 & \textcolor{OliveGreen}{-0.2}\\
						$Switch_{tot}$ & 124 & 78 & \textcolor{OliveGreen}{-37.1} & 129 & \textcolor{Bittersweet}{+4.0} & 3030 & 5976 & \textcolor{Red}{+97.2}\\
						\bottomrule
					\end{tabular}
				\end{table}
				\vspace{0.5cm}
				some \textcolor{blue}{text} here
				\begin{table}[]
					\begin{tabular}{l c c c c c c c c}
						\toprule
						& \multicolumn{5}{c}{\textbf{Applied to 1 day}} & \multicolumn{3}{c}{\textbf{Applied to 1 month}}\\
						\cmidrule(lr){2-6}\cmidrule(lr){7-9}
						\raisebox{2ex}[0pt][0pt]{\textbf{Parameter}} & \textbf{Real} & \textbf{Diff\_Evol} & $\boldsymbol{\Delta}$\textbf{(\%)} & \textbf{N-M} & $\boldsymbol{\Delta}$\textbf{(\%)} & \textbf{Diff\_Evol} & \textbf{N-M} & $\boldsymbol{\Delta}$\textbf{(\%)}\\
						\midrule
						$E_{tot}~\text{[kWh]}$ & 7958.07 & 8105.28 & \textcolor{Bittersweet}{+1.8} & 8061.38 & \textcolor{Bittersweet}{+1.3} & 203688 & 202833 & \textcolor{OliveGreen}{-0.4}\\
						$V_{em}~\text{[m}^3\text{]}$ & 7068.73 & 3312.00 & \textcolor{OliveGreen}{-53.1} & 3336.00 & \textcolor{OliveGreen}{-52.8} & 91788.4 & 91914.5 & \textcolor{Bittersweet}{+0.1}\\
						$Switch_{tot}$ & 124 & 81 & \textcolor{OliveGreen}{-34.7} & 125 & \textcolor{Bittersweet}{+0.8} & 2721 & 3462 & \textcolor{Red}{+27.2}\\
						\bottomrule
					\end{tabular}
				\end{table}
			\end{frame}

	\begin{frame}
		\centering
		\Large
		Thanks!\\
		\vspace{0.5cm}
		\LARGE
		Questions?\\
		\vspace{0.5cm}
		\begin{figure}[]
			\includegraphics[width=0.2\textwidth]{/confused.png}
		\end{figure}
	\end{frame}
% Written by Bibby AI
\end{document}
Preview

PDF Preview
Create an account to compile and preview