MyDarkMetropolisTemplate.texRead-only preview
% Written by Bibby AI
%% My Dark Metropolis Theme   %%
%% Daniel Kostuj, 2018        %%
%% Refer to the LICENSE file  %%
%% for copyright informations %%

%\documentclass[11pt]{beamer}
\documentclass[11pt, aspectratio=169]{beamer}
\usepackage{listings}
\usepackage{amsmath}
\usepackage{unicode-math}
\usepackage{pgfplots}
\usepgfplotslibrary{dateplot}


%% Listing Settings %%
\lstset
{basicstyle=\footnotesize\ttfamily\color{white},
rulecolor=\color{CodeFG},
frame=single,
backgroundcolor=\color{CodeBG},
language=C++}

%% Document Metadata %%
\title{My Dark Metropolis Template \& Examples }
\author{The Author}
\date{The Date}
\institute[INST]{The Institute}

%% Metropolis Theme %%
%\usetheme[progressbar=frametitle]{metropolis}
\usetheme{metropolis}

%% Custom Fonts %%
%\setsansfont{San Francisco Text}
\setmonofont{CMU Typewriter Text}

%% Custom Colors %%
\definecolor{VividCerulean}{HTML}{009de0}
\definecolor{MaastrichtBlue}{HTML}{011936}
\definecolor{BlueSapphire}{HTML}{19647e}
\definecolor{DarkSlate}{HTML}{204B57}
\definecolor{MidnightBlue}{HTML}{1b3b6f}
\definecolor{SpaceCadet}{HTML}{21295c}
\definecolor{DutchWhite}{HTML}{a4c2a5}
\definecolor{Box1}{HTML}{432e36}
\definecolor{Box2}{HTML}{260c1a}
\definecolor{Alert1}{HTML}{e55829}
\definecolor{Alert2}{HTML}{bc4622 }
\definecolor{Example1}{HTML}{2f9c95}
\definecolor{Example2}{HTML}{21706b}
\definecolor{CodeBG}{HTML}{131515}
\definecolor{CodeFG}{HTML}{2b2c28}

%% Beamer Colors %%
\setbeamercolor{frametitle}{bg=black, fg=white}
\setbeamercolor{frame}{bg=black, fg=white}
\setbeamercolor{progress bar}{fg=VividCerulean, bg=SpaceCadet}
\setbeamercolor{background canvas}{bg=black, fg=white}
\setbeamercolor{palette primary}{fg=white, bg=SpaceCadet}
\setbeamercolor{normal text}{fg=white, bg=SpaceCadet}
\setbeamercolor{block title}{fg=white, bg=Alert1}
\setbeamercolor{block body}{fg=white, bg=Alert2}
\setbeamercolor{block title alerted}{fg=white, bg=Alert1}
\setbeamercolor{block body alerted}{fg=white, bg=Alert2}
\setbeamercolor{block title example}{fg=white, bg=Example1}
\setbeamercolor{block body example}{fg=white, bg=Example2}
\setbeamercolor{alerted text}{fg=VividCerulean}
\setbeamercolor{itemize item}{fg=white}

%% Settings for Alert Blocks %%
\metroset{block=fill}

%% Settings for Custom Footline %%
\setbeamertemplate{footline}
{
  \leavevmode%
  \hbox{%
  \begin{beamercolorbox}[wd=.3\paperwidth,ht=2.25ex,dp=1ex,center]{frametitle}%
    \usebeamerfont{author in head/foot}\insertshortauthor \ (\insertshortinstitute)
  \end{beamercolorbox}%
  \begin{beamercolorbox}[wd=.47\paperwidth,ht=2.25ex,dp=1ex,center]{frametitle}%
    \usebeamerfont{title in head/foot}\insertshorttitle\hspace*{3em}
  \end{beamercolorbox}}%
  \begin{beamercolorbox}[wd=.23\paperwidth,ht=2.25ex,dp=1ex,center]{frametitle}%
    \insertframenumber{} \hspace*{1ex}
  \end{beamercolorbox}%
  \vskip0pt%
}


\begin{document}

\maketitle

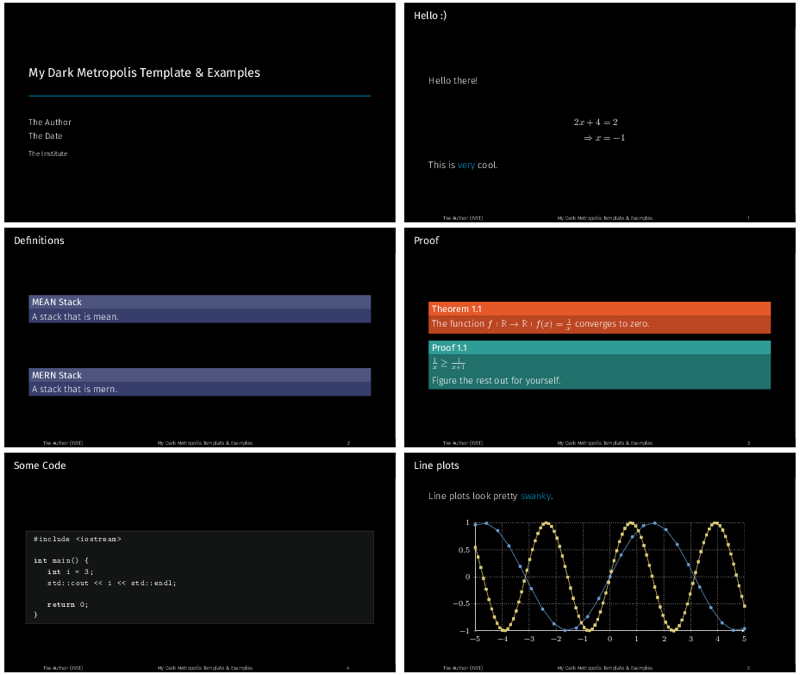
\begin{frame}{Hello :)}
 Hello there!

 \begin{align*}
  2x + 4 &= 2 \\
  \Rightarrow x &= -1
 \end{align*}


 This is \alert{very} cool.

\end{frame}

\begin{frame}{Definitions}
\begin{block}{MEAN Stack}
A stack that is mean.
\end{block}

\vfill

\begin{block}{MERN Stack}
A stack that is mern.
\end{block}
\end{frame}

\begin{frame}{Proof}

\begin{alertblock}{Theorem 1.1}
 The function $f : \mathbb{R} \rightarrow \mathbb{R} : f(x) = \frac{1}{x}$ converges to zero.
\end{alertblock}


\begin{exampleblock}{Proof 1.1}
 $\frac{1}{x} \geq \frac{1}{x+1}$

 Figure the rest out for yourself.
\end{exampleblock}


\end{frame}


\begin{frame}[fragile]{Some Code}
 \begin{lstlisting}
 #include <iostream>

 int main() {
    int i = 3;
    std::cout << i << std::endl;

    return 0;
 }
 \end{lstlisting}
\end{frame}

\begin{frame}{Line plots}
 Line plots look pretty \alert{swanky}.
   \begin{figure}
    \begin{tikzpicture}
      \begin{axis}[
        mlineplot,
        width=0.9\textwidth,
        height=6cm,
      ]

        \addplot {sin(deg(x))};
        \addplot+[samples=100] {sin(deg(2*x))};

      \end{axis}
    \end{tikzpicture}
  \end{figure}
\end{frame}

\begin{frame}{Bar charts}
Bar charts, too.
  \begin{figure}
    \begin{tikzpicture}
      \begin{axis}[
        mbarplot,
        xlabel={Foo},
        ylabel={Bar},
        width=0.9\textwidth,
        height=6cm,
      ]

      \addplot plot coordinates {(1, 20) (2, 25) (3, 22.4) (4, 12.4)};
      \addplot plot coordinates {(1, 18) (2, 24) (3, 23.5) (4, 13.2)};
      \addplot plot coordinates {(1, 10) (2, 19) (3, 25) (4, 15.2)};

      \legend{lorem, ipsum, dolor}

      \end{axis}
    \end{tikzpicture}
  \end{figure}
\end{frame}
\begin{frame}{Quotes}
  \begin{quote}
    C++ allows you to shoot yourself in the foot.
  \end{quote}
  Bernd Störstrup
\end{frame}


\begin{frame}{Animation}
  \begin{itemize}[<+- | alert@+>]
    \item \alert<4>{This is\only<4>{ really} important}
    \item Now this
    \item And now this
  \end{itemize}
\end{frame}

{
\setbeamertemplate{footline}{}
\begin{frame}[standout]
 Bye!
\end{frame}
}

% Written by Bibby AI
\end{document}
Preview

PDF Preview
Create an account to compile and preview