fem_basis_function_constant_dg.texRead-only preview
% fem_basis_function_linear_cg.tex

\documentclass[11pt]{article}

% Set page legths
\special{papersize=50cm,50cm}
\hoffset-0.8in
\voffset-0.8in
\setlength{\paperwidth}{50cm}
\setlength{\paperheight}{50cm}
\setlength{\textwidth}{45cm}
\setlength{\textheight}{45cm}
\topskip0cm
\setlength{\headheight}{0cm}
\setlength{\headsep}{0cm}
\setlength{\topmargin}{0cm}
\setlength{\oddsidemargin}{0cm}
% set the pagestyle to empty (removing pagenumber etc)
\pagestyle{empty}

% load packages:
\usepackage{amsmath}
\usepackage{amssymb}
\usepackage{amstext}
\usepackage{amsfonts}
\usepackage{units}
\usepackage{ifthen}

% tikz etc:
\usepackage{tikz}
\usepackage{pgfplots}
%\usepgfplotslibrary{external}
%\tikzexternalize
% Use newest spacing options (from v. 1.3 on)
\pgfplotsset{compat=newest}
\pgfplotsset{width=10cm}
\pgfplotsset{height=6cm}

\usepackage[active, tightpage]{preview}
\PreviewEnvironment{tikzpicture}
\setlength\PreviewBorder{0pt}

\usetikzlibrary{calc, shapes.geometric, arrows, positioning, backgrounds}
\tikzset{major tick/.style={semithick},
    x tick label/.style={anchor=north, minimum width=7mm}
}

\begin{document}
  \centering
    \begin{tikzpicture}[scale=4,
      line/.style={-,thick},
      helpline/.style={line,dashed,gray}
      ]

      % Main axis:
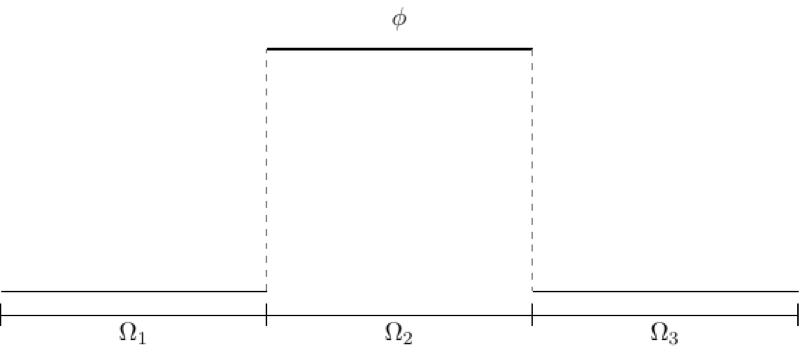
      \foreach \x/\label in {0/1,1/2,2/3,3/4} {
        \coordinate (a\label) at (\x,0);
      }
      \draw (a1) -- (a4);
      % Labels and ticks on the x axis:
      \foreach \x in {0,1,...,3} {
        \draw[major tick] (\x, 1.25pt) -- (\x, -1.25pt);
      }
      \foreach \x/\label in {0/1,1/2,2/3} {
        \node[x tick label] at (\x+0.5, 0) {$\Omega_{\label}$};
      }

      % basis function:
      \def\defaulty{2.5pt}
      \coordinate (p1) at (0,\defaulty);
      \coordinate (p2) at (1,\defaulty);
      \coordinate (p3) at (1,1);
      \coordinate (p4) at (2,1);
      \coordinate (p5) at (2,\defaulty);
      \coordinate (p6) at (3,\defaulty);
      % draw the basis function:
      \draw[line] (p1) -- (p2);
      \draw[helpline] (p2) -- (p3);
      \draw[line] (p3) -- (p4);
      \draw[helpline] (p4) -- (p5);
      \draw[line] (p5) -- (p6);
      \node[label=above:$\phi$] at(1.5,1) {};

    \end{tikzpicture}
\end{document}
Preview

PDF Preview
Create an account to compile and preview